 AvertIT: 2008-2012
FP7 IST-2007-217049 ICT Programme - AVERT-IT- A Bayesian Neural Network Predicting Hypotension.
Avert-IT was an EU-funded project to develop a mechanism, for use within intensive and high-dependency care units, which will have the ability to monitor and predict the likelihood of arterial hypotension (low blood pressure) adverse events. The full project title is “Advanced Arterial Hypotension Adverse Event prediction through a Novel Bayesian Neural Network” and was completed in 2012.

Background
Intensive Care patients can experience adverse events associated with sudden episodes of low blood pressure. These adverse events may impact all of the main organs resulting in longer lengths of stay, increased care costs and reducing quality of outcomes. Existing technologies enable clinicians to know when these events have occurred and treat the effects. Medical therapies and management for treating adverse events such as low blood pressure exist but clinicians don’t have a reliable way to predict the occurrence, so there’s no opportunity for early intervention.
Research indicates average lengths of stay in intensive care could be significantly reduced if these adverse events can be avoided through prediction and earlier intervention. By reducing the cost of intensive care intensive care services (typically > 1000 Euro's per day) could lead potentially to savings across the EU in the billions of euros, annually.
As arterial hypotension is a common form of adverse event, a model for predicting these offers potential for improving outcomes across a wide range of conditions and or illnesses.
Objectives
The main scientific objective of the project is the determination of the weighted association between multiple patient parameters and subsequent arterial hypotension. The association will then be used to define the novel Bayesian neural network, which will be trained against the existing BrainIT dataset (collected from 20 centres across Europe), before undertaking a clinical trial to demonstrate the Avert-IT project concept.
The main technological objective will be the development of an IT-based decision support system (“HypoPredict&rdquot;) appropriate for deployment within intensive and high dependency care units. The system will be capable of:
- Automatically and continually monitoring at least four in-vivo patient parameters (eg: ECG, arterial blood pressure, Oxygen saturation and core temperature), together with open interfaces providing input of key demographic data (age, gender etc.) and periodic data (clinical pathology results etc.) related to the patient.
- Outputting a continuous Hypotension Prediction Index (HPi) which will be updated on a minute by minute basis upon any change detected in the patient parameter input set.
Current Status
Having successfully trained the BANN on existing cleaned data acquired from the BrainIT group (www.brainit.org), the final stage of the project was focused on collecting data from 60 patients in an observational study to test that the AVERT-IT technology meets the clinician’s minimum requirements for sensitivity (>30%) and false positive rate (FPR) (< 10%) for prediction of arterial hypotension (low blood pressure). This work was successfully completed and the calculated sensitivity and specificity from using the BANN system in a live clinical environment were found to be 40.09% and 92.57% respectively.
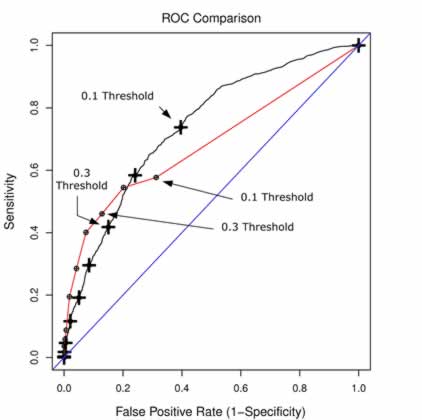
In the figure above - the ROC curve from the research phase is shown by the black line. The point estimates for mean sensitivity and false positive rate at the threshold values 0.1 to 0.9 are shown on the solid red curve. The prospective clinical study results (red line) are very close to the research results particularly in the range of interest with a threshold setting of between 0.3 and 0.4 giving a specificity range of 46.03% and 40.09% and a specificity range of 87.13% and 92.57% respectively.
The BANN hypopredict technology is showing promise. We are optimistic that this research will provide the basis for future research assessing the clinical utility of this type of medical decision support upon reducing the length of stay for patients managed in the intensive care environment.
We are currently seeking funding to further develop the AVERT-IT model towards improving it's prediction sensitivity and exploiting it's technology for use within the NHS and health care sector.
Where to Now?
One of the findings from the AvertIT project was that we estimate that approximately 30% of potential arterial hypotension events are not quantifiable due to either missing data or artifact from blood sampling, patient handling or other clinical interventions. It is felt that before implementing models such as the AvertIT BANN, we should first investigate approaches to automatically detecting and cleaning blood pressure artifact from the raw data. Towards that end, Glasgow has a project funded from the Scottish Chief Scientists Office (CSO) collaborating with (Chris Williams) Machine Learning group at Edinburgh University. They are developing two models for detection of artifact in blood pressure time-series data: a) a Factorial Switching Linear Dynamical Systems (FSLDS) model and b) a Discrimitive Switching Linear Dynamical Systems (DSLDS) model. The figure below shows examples of the two models performance for detecting blood sample artifact and arterial pressure damped trace artifact. If this project is successful in showing proof of concept for detecting and cleaning major artifact from the Blood Pressure time-series signal in real time in a live clinical environment, this will make if much more feasible to run predictive models that use the Blood Pressure channel in the intensive care setting. This project was successfully completed May 2015. Click below to access a report of the final results. Final Results)
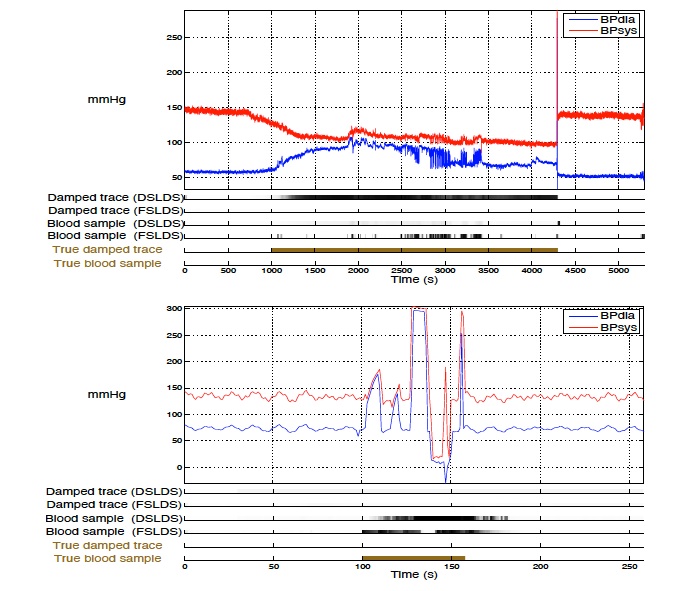
Figure: Example of DSLDS and FSLDS inferences for a damped trace event (top) and a blood sample event (bottom). Note the Ground Zero Truth (expert manual validation) is shown in a gold colour at the bottom bar).
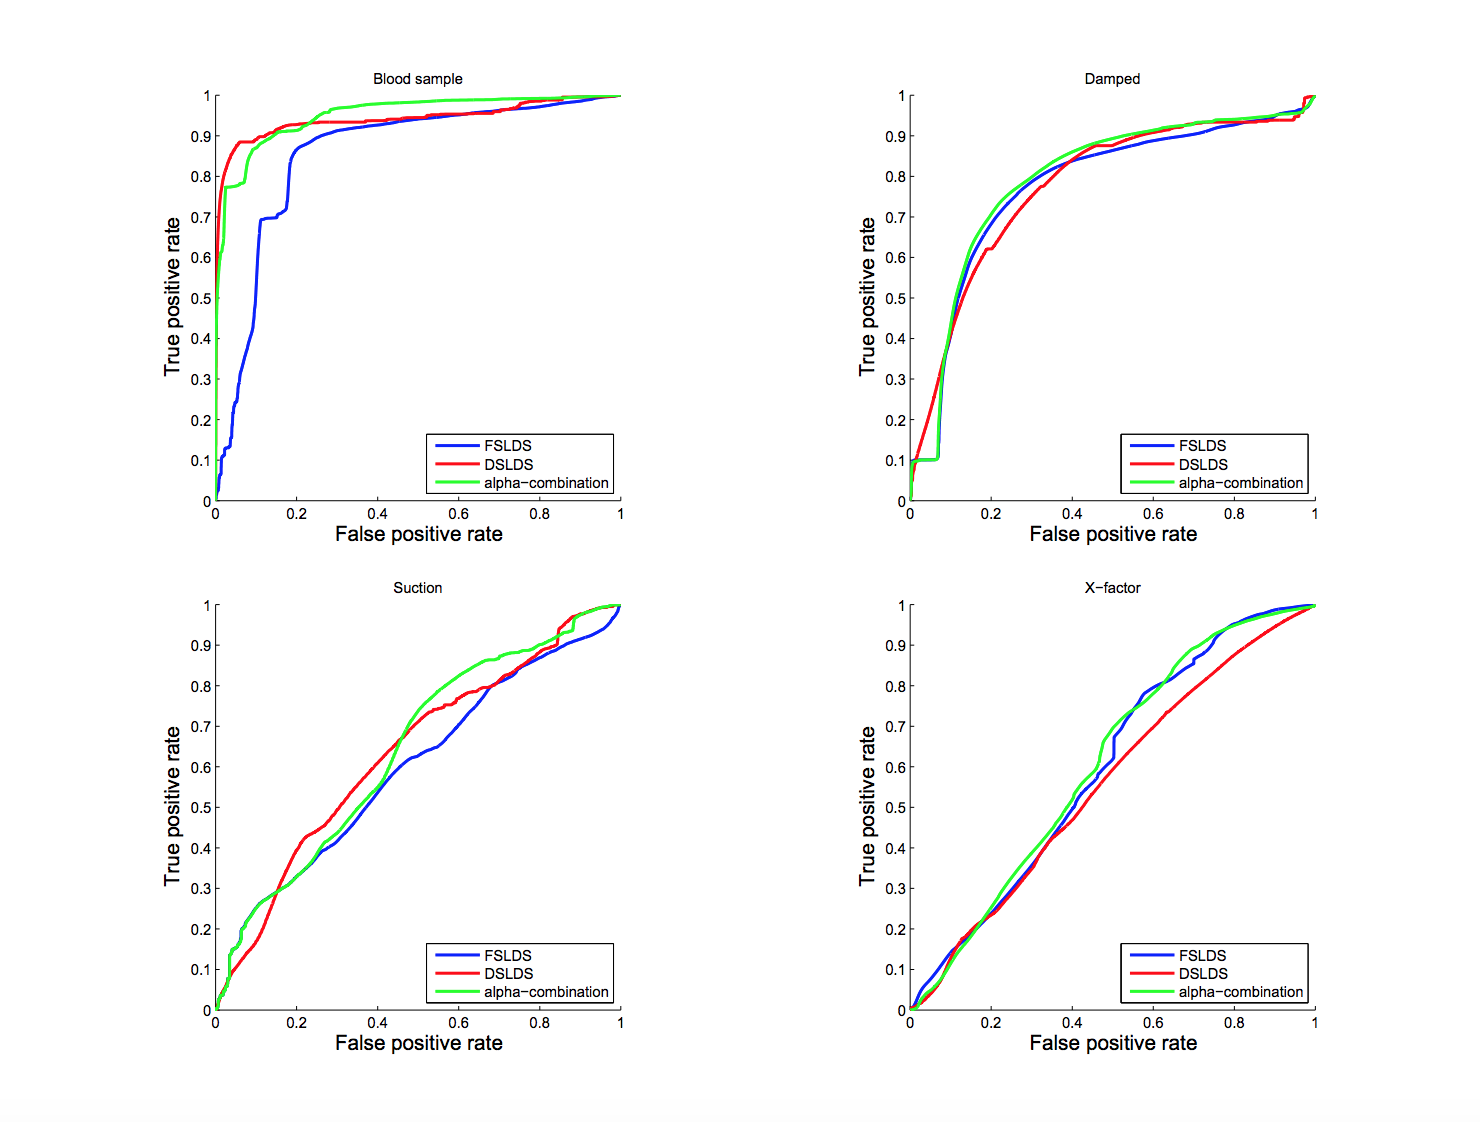
Figure: ROC curves for the blood sample, damped trace, suction and X factor computed from the FSLDS, DSLDS and α-mixture outputs.
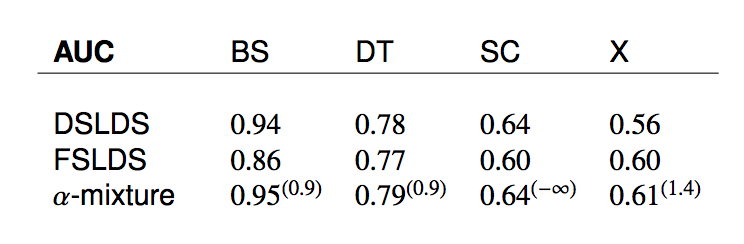
Table showing the overall AUC scores per factor for the FSLDS, DSLDS and α-mixture. The optimal value of the α parameter per factor is shown inside parentheses.